Updates to Google Webmaster Tools

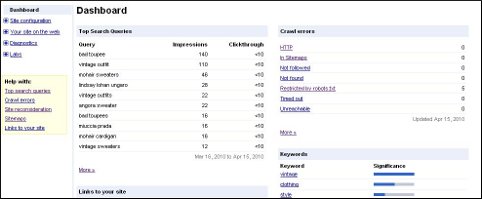
Have you opened up Google Webmaster Tools recently? If not, you should, because you’ll find a bunch of new features. Your webmaster tools dashboard shows top search queries, links to your site, crawl errors, sitemaps, and more, as you can see in the screen shot. From the dash, you can get more information on any of these. The next screen shot shows all the webmaster tools options that show up in the left hand column of your dashboard.


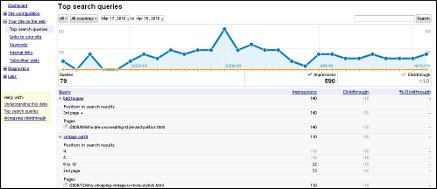
If, for example, you’re looking at your top search queries, which is located under the “Your Site on the Web” menu, you can go down to the bottom of the list where it says “more” and click. You’ll be taken to a page with a graphic representation of your queries by date, and a breakdown of individual search terms, and where you rank for them, as seen in the next screen shot. Also under “Your Site on the Web” you can find links to your site, keywords, internal links, and subscriber statistics.

You used to only be able to see your site’s top 100 search queries, but now you can see many more. If your site ranks for more than 100, you’ll see page buttons at the bottom of the “Top Search Queries” list. And the graphic that appears of your top search queries used to be something you had to download and make into a chart yourself, so this new feature is especially handy. You also get a date range selector like what you have on Google Analytics so you can narrow down your data for a particular time period.
Under the “Site Configuration” menu, you can visit sitemaps, crawler access, sitelinks if any. These are the internal links that Google sometimes puts in search results, as you can see in the screenshot. There is also a “settings” section, in which you can set geographical targets, view your crawl rate stats, and parameter handling, which some webmasters use for more efficient crawling with fewer duplicate URLs. You don’t have to set any of these, because there are defaults, but some webmasters may want to. Some people have raised concerns that having country-specific sites will cause duplicate content issues, but this isn’t the case, so setting geographical targets will not harm your rankings.

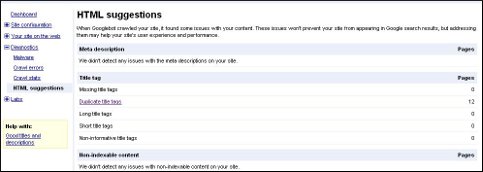
Diagnostics is another handy set of features. From the Diagnostics menu, you can check for malware on your site, crawl errors, crawl stats (which gives you Googlebot activity over the preceding 90 days), and HTML suggestions. The HTML suggestions page tells you if there are any problems with malware on your site, and a breakdown of title tag information, which includes duplicate or missing title tags, short title tags, non-informative title tags, and long title tags. It also alerts you if there is non-indexable content on your pages. Just FYI, the Malware diagnostic used to be under the “Labs” menu, but late in 2009 it “graduated” to the Diagnostics menu.
The Labs menu lets you play with new tools that may or may not stick around. One thing you can do is see what your site (either the homepage, which is the default, or a specific page, whose URL you type in) looks like to the Googlebot by choosing “Fetch as Googlebot” under the Labs menu. Once you click on “fetch” you’ll get a listing of your site and under Status, you should see “Success” and a green check mark. Click on “Success” and you’ll see the source information for your page as it is seen by the Googlebot.
You can make a Sidewiki for your site under the Labs menu, too. It may not be something you’re interested in, but a Sidewiki is a browser plugin for IE and Firefox that adds a universal commenting system for any and every page on the internet. To use it, you have to install the Google Toolbar for IE or Firefox, and Google says they’re working on a version for Chrome. When you install the toolbar with the Sidewiki in it, you go to a landing page telling you how to use it. Sidewiki entries are displayed with the most useful and high quality entries first, based on running the Sidewiki information through an algorithm to determine this. Toolbar haters will probably want to skip this one.
The Site Performance option under the Labs menu basically leads you through installation of the Page Speed browser add-on for Firefox that helps you figure how fast your site loads and what you can do to maximize load speed. Page Speed runs a bunch of diagnostics against a page and analyzes various performance parameters based on things like resource caching, upload and download sizes, and client-server round trips. You’ll get a red / yellow / green grading scheme for all the parameters, plus specific suggestions for making your page faster. It also does some automatic optimization such as compressing images and “minifying” JavaScript code.
This is very valuable information, and there are even suggestions and hints on how to do things like speeding up your site by installing a Firefox add-on called Page Speed. Honestly, you could spend half a day going through the data you now get from Webmaster Tools and probably come up with a dozen tweaks to your site that will fine tune its performance. Initial reaction to the new tools – particularly the top search queries – has been very positive.


