

Google Local Services Ads charge you per lead rather than per click. A lead is a phone call or a text message, it comes from the panel of green-check-marked businesses sitting above every other result, and for a plumber, an HVAC company or a pest control firm it is usually the easiest advertising there is to switch on.
There is a reason to care about that cost in context rather than in isolation. Local Services Ads sit above every aggregator on the page, and the alternative is renting a slot on somebody else’s list — we counted how much of the first page those lists now occupy in this measurement of six home services searches.
What almost nobody does is divide one number in the reporting by another. When you do, the same thing turns up in every account we have looked at: a charged phone lead costs roughly 1.8 times what a charged text lead costs, while the two arrive in near-equal numbers. Calls end up taking about two thirds of the budget for about half the leads.
Here is where that comes from, and what it changes.
The numbers, and what has been removed from them
Two accounts, both ours, both in home services. One covers July 2026, the other the thirty days to 20 August 2026. The dashboards are below with the spend, the charged lead counts and the account identity blacked out — those are the client’s business and not ours to publish — and the rates left in, because a rate does not tell you how big anybody is.
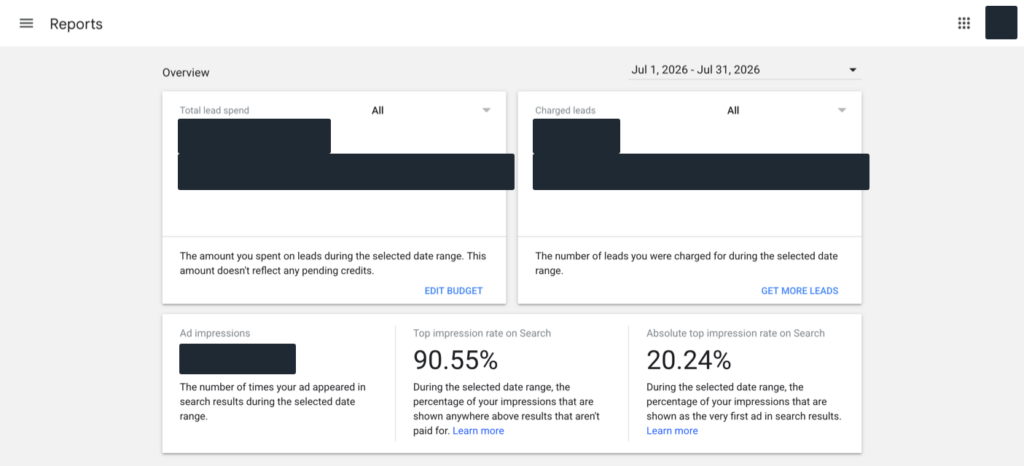
Doing the division on the figures underneath the redactions gives this:
- Phone lead against text lead: 1.88 times in the first account, 1.76 times in the second.
- Lead mix: 51% phone and 49% text in the first, 54% and 46% in the second.
- Spend mix: 66% of the budget went to phone leads in the first account, 67% in the second.
Two different accounts, two different date ranges, and near enough the same answer in both. That is what makes it worth writing down rather than treating it as one odd month.
What the two percentages mean
Top impression rate on Search is how often your ad showed up anywhere above the results people have not paid for. Absolute top impression rate is how often you were the very first thing on the page. They sound like the same metric and they are not, and the gap between them is where the management happens.
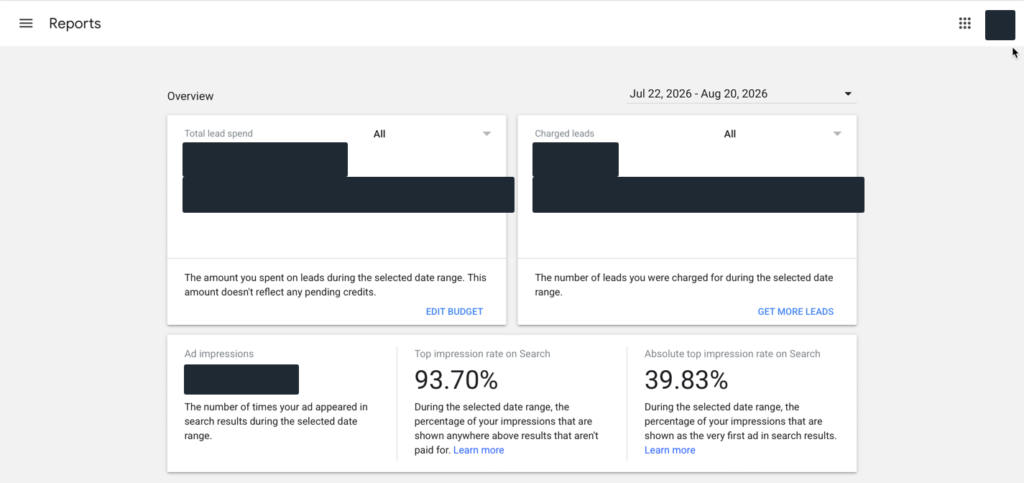
Both accounts hold above 90% on the first figure. On the second they split hard: 20.24% in one, 39.83% in the other. Same programme, same kind of business, and roughly double the share of first position in one of them.
That difference is not budget. Budget governs how much of the available demand you can absorb, not whether you outrank a competitor with better reviews and a faster phone. The difference is proximity, review volume and response time, which are the three things Google has been open about weighting and the three things most owners treat as somebody else’s department.
So what do you do with the 1.8?
Staff the phone like it is the expensive channel, because it is. The half of your lead flow that costs two thirds of the money is the half that hangs up when nobody answers. A missed call is not a neutral event here either: response rate feeds the ranking, so the call you did not take makes the next lead more expensive as well.
Measure the two separately from day one. The dashboard gives you phone and message side by side and then reports a single blended cost per lead everywhere else. If you only ever look at the blended number you will never see the ratio, and you will never notice it moving.
Do not conclude that texts are better value. This is the part we cannot tell you. We have no close rate attached to either lead type in this data, so anybody claiming texts convert better or worse than calls is guessing. Cheaper per lead is not the same as cheaper per customer, and the only way to know which is which in your business is to tag them and follow them through.
The part Google has not built
Grading is the weak spot. Google lets you mark each lead as it arrives — booked, not a fit, spam — and that mark is what the dispute process and your own reporting both rest on. It is a click, by a person, on every single lead.
At ten leads a month that is fine. At a couple of hundred it quietly stops happening, and the moment it stops, two things go wrong at once: the leads you should not have paid for never get disputed, and the cost per lead you think you are paying drifts away from the one you are actually paying. Neither failure shows up as a number anywhere. They show up as a slightly worse account that nobody can explain.
John Wieber, who runs these accounts, puts it more briefly:
It suits small businesses because it is easy to implement. Beyond configuring the business and putting a card on the account, there is very little to manage: you set it up and the leads arrive. Grading them is the exception. It is still done one lead at a time as they come in, and that is a real handicap to LSA as it stands.
That is why the leads need to land in a CRM rather than in an app on somebody’s phone: so the conversation is recorded, nothing sits unanswered, and the grade can come from what actually happened on the call instead of from somebody remembering to click. We run ours on HighLevel and are extending it into grading that happens off the CRM record rather than by hand. It is not a Google feature and we are not expecting one.
Two more things worth knowing before you sign up
You need to be verified, and you need ten reviews. Licence, insurance and a background check get you the badge. Reviews get you through the door: you cannot open a Local Services Ads account with fewer than ten, so if you are sitting on six, that is the first job and no amount of budget substitutes for it. Past that gate they keep earning, because both the score and the count feed the ranking.
The interface has genuinely been unreliable. We wrote up a stretch in September 2024 where the sign-up forms reset themselves over and over and the budget screen would spin without ever saving, in Chrome and in Firefox both. What finally worked was doing it in Brave. If you are stuck on that screen right now, it is worth knowing that plenty of people have concluded they were doing something wrong when they were not.
The short version
Local Services Ads are the easiest paid channel to turn on and one of the easiest to leave running badly. The switching on takes an afternoon. What separates an account at 20% absolute top from one at nearly 40% is reviews, response times and a service area drawn to fit the vans rather than the ambition — and what separates a real cost per lead from a flattering one is somebody grading and disputing every month.
The organic equivalent of a service area drawn to fit the vans is a set of location pages built for the towns you actually work in. We went through the evidence on how many service area pages a business should have, and the number is smaller than most agencies sell.
The full version of how the programme works, what verification asks for and what decides your rank is on our Local Services Ads page. If you would rather we just looked at the account, that is what the paid media practice is for.